Publication Overview
Knowledge graphs provide a structured way to represent real-world entities, their attributes, and the relationships among them. In property and casualty insurance, they can connect fragmented information across claims, policies, insureds, claimants, providers, attorneys, vehicles, properties, documents, transactions, exposures, and events—while preserving context and provenance.
Executive premise A knowledge graph does not merely store facts. It makes relationships explicit, traceable, and computable. That allows insurance teams and AI systems to reason over connected evidence rather than treating every record or document as an isolated object.
Chapter Map
| Section | What It Covers |
|---|---|
| 1 | Executive Snapshot and Quick Facts |
| 2 | Definitions and Core Concepts |
| 3 | How Knowledge Graphs Work |
| 4 | Insurance Data Model and Ontology Design |
| 5 | Applications Across the P&C Value Chain |
| 6 | Detailed Claims Case Study |
| 7 | Detailed Underwriting Case Study |
| 8 | Knowledge Graphs with RAG, LLMs, and Agents |
| 9 | Business Benefits and Value Measurement |
| 10 | Risks, Governance, Security, and Compliance |
| 11 | Implementation Blueprint and Best Practices |
| 12 | Executive Decision Guide |
| 13 | Charlee.ai Perspective |
| 14 | Illustration Briefs |
| 15 | FAQs, Related Terms, SEO/AEO, and Publication Controls |
Chapter Map
Editorial note: Examples in this chapter are illustrative and should be adapted to each carrier’s products, jurisdictional requirements, data rights, operating model, and model-risk framework.
Executive Snapshot
One-sentence definition A knowledge graph is a connected, machine-readable representation of entities, concepts, events, documents, and the relationships among them, usually enriched with business meaning, source provenance, and rules.
Executive Summary
Insurance information is inherently relational. A bodily injury claim connects an accident, a policy, multiple vehicles, drivers, passengers, medical providers, diagnoses, treatments, attorneys, demands, reserves, payments, and litigation events. Traditional systems often store these facts in separate tables, files, applications, and documents. A knowledge graph creates an enterprise relationship layer that makes those connections explicit.
The business value is not the graph itself. Value emerges when the graph enables faster investigation, more complete context, earlier pattern detection, better search, stronger explainability, reusable institutional knowledge, and more reliable AI. The graph can support human users directly through relationship views and semantic search, or indirectly as a grounding layer for predictive models, retrieval-augmented generation, and AI agents.
Knowledge graphs are particularly useful when the organization needs to combine structured and unstructured data; preserve source and time context; reconcile multiple identifiers; expose many-to-many relationships; reason over networks; or provide evidence trails for an AI-generated conclusion.
They are not a replacement for policy, claims, billing, document, or data-warehouse systems. A well-designed graph complements those systems by connecting their information through a governed semantic model. The design challenge is therefore as much organizational as technical: define the concepts, ownership, identifiers, relationships, provenance, access controls, and lifecycle rules that make the graph trustworthy.
Quick Facts
| Dimension | Practical Meaning |
|---|---|
| Primary purpose | Represent and query connected business knowledge |
| Basic building blocks | Nodes or entities, edges or relationships, and properties or attributes |
| Insurance strength | Connecting fragmented claims, policy, party, document, event, and exposure data |
| Typical query | How is this person, provider, vehicle, address, attorney, or event connected to other claims? |
| AI role | Grounding, retrieval, context assembly, reasoning support, and explainability |
| Key requirement | A governed ontology or semantic model with reliable identity resolution |
| Major risk | Incorrect links can propagate false context and create misleading conclusions |
| Human role | Define meaning, validate relationships, resolve ambiguity, and make decisions |
What Executives Should Remember
- A knowledge graph turns disconnected records into connected business context.
- The highest-value use cases involve relationships, provenance, and cross-system evidence—not simple record lookup.
- Graph quality depends on identity resolution, ontology governance, temporal accuracy, and source traceability.
- The graph should support professional judgment; it should not silently make coverage, liability, fraud, or claim decisions.
- Knowledge graphs become more valuable when paired with semantic search, RAG, predictive AI, and controlled agent workflows.
Definitions and Core Concepts
Executive Definition
A knowledge graph is an enterprise knowledge layer that connects information about business objects and events so people and systems can understand not only what is known, but how the facts relate and where they came from.
Technical Definition
A knowledge graph is a graph-structured data representation in which nodes represent entities or concepts, edges represent typed relationships, and properties describe nodes or edges. The graph is typically governed by an ontology or schema and may support inference, semantic constraints, temporal modeling, provenance, embeddings, and graph analytics.
Insurance Definition
In P&C insurance, a knowledge graph represents connected knowledge about policies, coverages, claims, losses, people, organizations, locations, assets, providers, attorneys, documents, transactions, exposures, and events. It enables carriers to trace how facts and evidence are related across the claim and policy lifecycle.
Core Vocabulary
| Term | Insurance-Oriented Explanation |
|---|---|
| Node / entity | A real-world object or concept such as a claim, policy, person, vehicle, property, provider, document, or diagnosis. |
| Edge / relationship | A typed connection such as insured-by, involved-in, treated-by, represented-by, located-at, cites, or derived-from. |
| Property | An attribute attached to a node or relationship, such as loss date, policy status, confidence score, role, or effective period. |
| Ontology | A formal business model that defines concepts, relationship types, constraints, hierarchies, and meanings. |
| Taxonomy | A controlled classification hierarchy, often narrower than an ontology. |
| Triple | A subject-predicate-object statement, such as Claim 123 — involves — Vehicle ABC. |
| Provenance | Information describing the origin, extraction method, timestamp, and evidence supporting a fact or relationship. |
| Identity resolution | The process of determining whether different records refer to the same real-world entity. |
| Inference | Deriving a new relationship or classification from existing facts and governed rules. |
| Graph traversal | Following relationships across one or more hops to answer a connected question. |
| Subgraph | A relevant subset of the larger graph assembled for a user, model, search, or agent task. |
| Graph embedding | A numeric representation of nodes or relationships used for similarity, prediction, or retrieval. |
Knowledge Graph vs. Graph Database
A graph database is a technology for storing and querying graph-shaped data. A knowledge graph is the business and semantic asset created by combining graph data, definitions, relationships, provenance, governance, and intended uses. A carrier may implement a knowledge graph with a native graph database, an RDF store, relational technology, a cloud data platform, or a combination of technologies.
Knowledge Graph vs. Data Warehouse
| Dimension | Data Warehouse | Knowledge Graph |
|---|---|---|
| Primary organization | Tables, facts, and dimensions | Entities and typed relationships |
| Best at | Aggregations, reporting, historical metrics | Connected context, traversal, semantic relationships |
| Schema emphasis | Predefined analytic structures | Business meaning and relationships |
| Many-to-many relationships | Often modeled through bridge tables | Natural graph representation |
| Explainability | Lineage and report logic | Path, provenance, and evidence relationships |
| Role | System for analytics and reporting | Semantic connection and reasoning layer |
How Knowledge Graphs Work
The Operating Pattern
| Stage | What Happens |
|---|---|
| 1. Source | Claims, policy, billing, CRM, documents, correspondence, telematics, external data, and reference sources. |
| 2. Extract | Capture entities, attributes, events, references, and relationships from structured and unstructured information. |
| 3. Resolve | Match records to the correct person, organization, asset, address, provider, or other real-world entity. |
| 4. Normalize | Standardize names, codes, dates, units, jurisdictions, document types, and identifiers. |
| 5. Map | Align source data to the insurance ontology and approved relationship vocabulary. |
| 6. Load | Create or update nodes, edges, properties, confidence values, effective dates, and provenance. |
| 7. Validate | Apply data-quality rules, referential checks, business constraints, human review, and exception handling. |
| 8. Serve | Support graph queries, search, analytics, RAG, models, dashboards, and controlled agent actions. |
| 9. Monitor | Track quality, drift, stale relationships, access, usage, corrections, and business outcomes. |
Nodes, Edges, and Properties
Consider a commercial auto loss. The graph might contain nodes for the claim, policy, insured organization, tractor, trailer, driver, claimant, accident location, police report, medical provider, attorney, demand letter, reserve transaction, and lawsuit. Relationships connect the driver to the vehicle, vehicle to claim, claimant to treatment, attorney to claimant, demand to document, document to extracted facts, and every fact to its source and effective date.
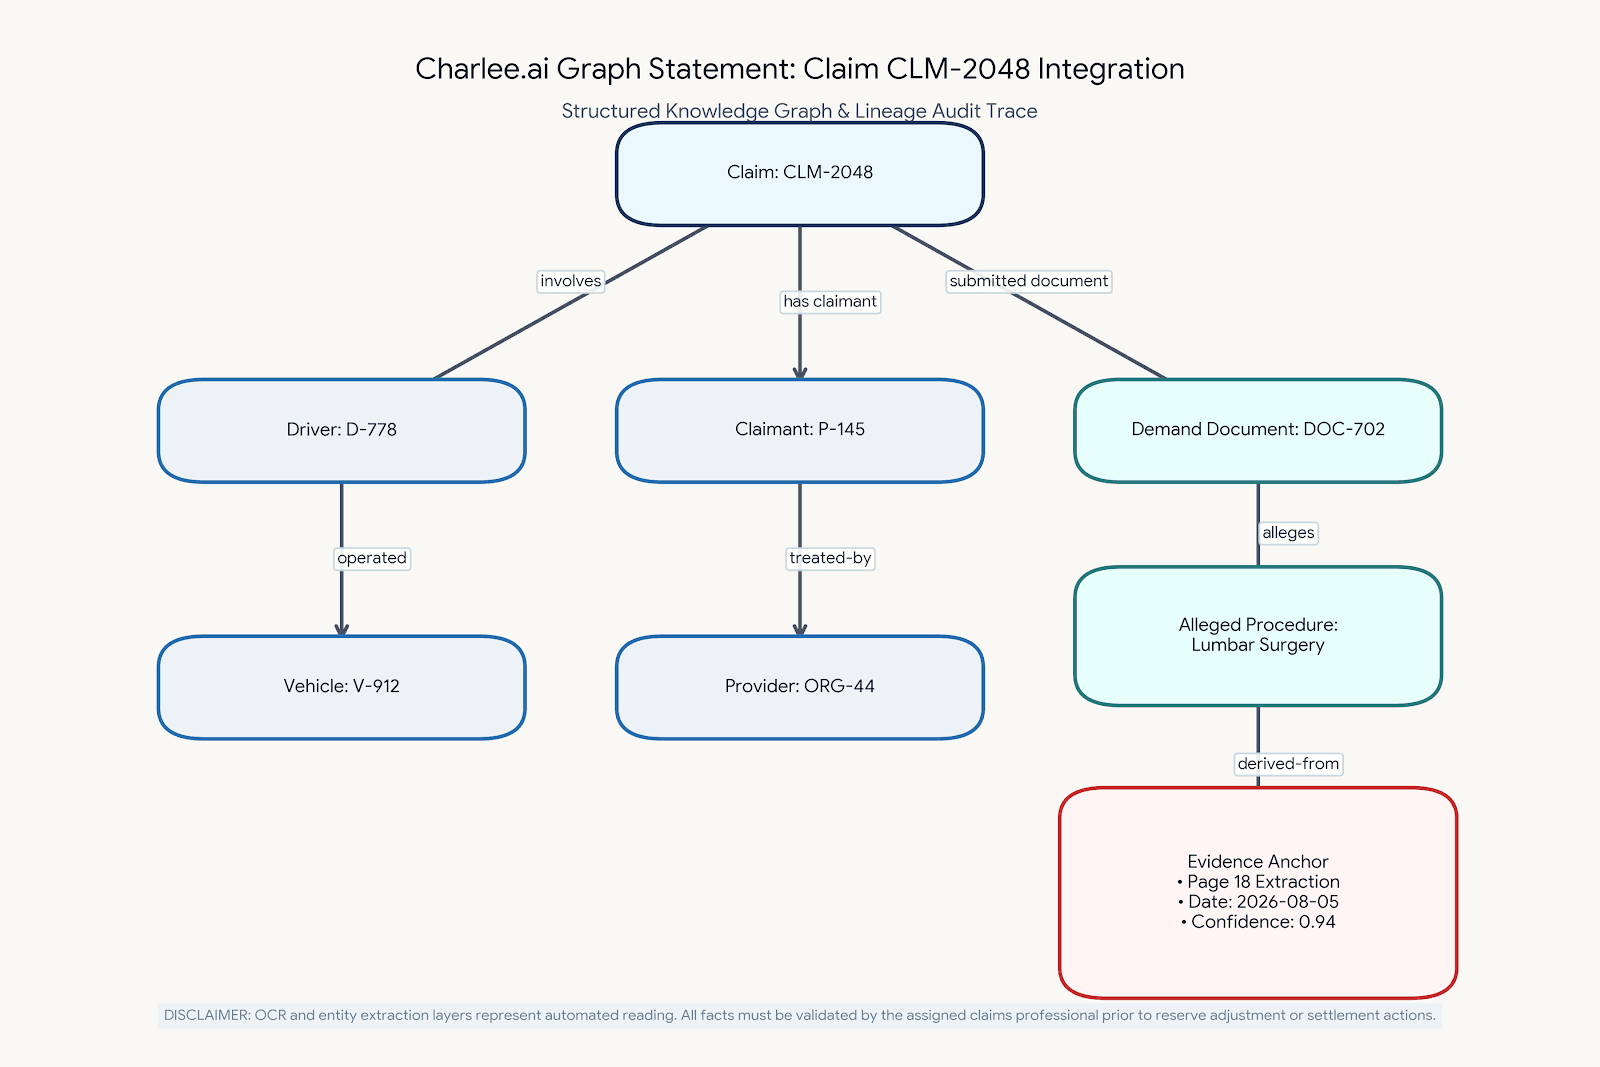
Nodes, Edges, and Properties
Illustrative graph statement
Property Graph and RDF Approaches
| Approach | Characteristics | Insurance Fit |
|---|---|---|
| Property graph | Nodes and relationships can hold properties; intuitive traversal languages; often operationally accessible. | Useful for relationship exploration, investigation, operational applications, and graph analytics. |
| RDF / semantic graph | Represents subject-predicate-object triples; supports shared vocabularies, ontologies, and semantic standards. | Useful when formal semantics, interoperability, reasoning, and standards-based knowledge representation matter. |
| Hybrid | Combines graph storage, semantic layers, vector search, relational sources, and document indexes. | Common enterprise pattern when carriers need practical performance plus governed semantics. |
Entity Resolution: The Critical Foundation
Graphs magnify both good and bad identity decisions. Linking two records that belong to the same provider can reveal meaningful network patterns. Linking two different people with similar names can produce a false narrative. Identity resolution should therefore use approved identifiers, normalization, probabilistic matching, confidence thresholds, conflict rules, temporal evidence, and human review for consequential cases.
Temporal Knowledge
Insurance facts change. A claimant may retain counsel after initial contact. A policy endorsement may alter coverage. A provider address may change. A reserve may be revised repeatedly. The graph should distinguish event time, effective time, discovery time, and system load time when those distinctions affect interpretation. Replacing an old fact without preserving history can destroy the evidence needed to understand a decision.
Provenance and Confidence
Every material fact should be traceable to an authoritative system, document, page, communication, external source, or approved inference. Extracted facts may also need confidence scores and review status. Provenance allows a professional to inspect the evidence instead of accepting an unexplained graph assertion.
Insurance Data Model and Ontology Design
Why Ontology Design Matters
The ontology determines what the graph means. Without clear definitions, the graph becomes a collection of loosely connected records that different users interpret differently. Insurance ontology design should be driven by business questions, regulatory context, source-system realities, and the decisions the graph is intended to support.
Illustrative P&C Entity Domains
| Domain | Example Concepts |
|---|---|
| Contract | Policy, coverage, endorsement, limit, deductible, condition, exclusion |
| Claim | Claim, exposure, feature, reserve, payment, recovery, referral, diary |
| Loss event | Accident, catastrophe, injury, damage, allegation, cause, location |
| Party | Insured, claimant, driver, passenger, witness, adjuster, underwriter |
| Organization | Employer, provider, attorney firm, vendor, repair facility, agency |
| Asset | Vehicle, building, equipment, inventory, insured location |
| Document | FNOL, police report, estimate, medical record, demand, pleading, email |
| Medical | Diagnosis, procedure, treatment, provider, bill, impairment, restriction |
| Legal | Representation, venue, complaint, motion, mediation, trial, settlement |
| Risk | Hazard, peril, exposure, control, recommendation, appetite, referral |
| External context | Weather, geography, sanctions, corporate hierarchy, public record |
Illustrative Relationship Vocabulary
| Relationship | Business Meaning |
|---|---|
| Policy — covers — Asset | Connects the contract to the insured object. |
| Claim — arises-from — Loss Event | Links the claim to the underlying occurrence. |
| Person — involved-in — Claim | Captures role-specific involvement. |
| Claimant — represented-by — Attorney | Supports legal and litigation context. |
| Claimant — treated-by — Provider | Connects treatment networks to the claim. |
| Document — supports — Fact | Ties evidence to a graph assertion. |
| Payment — issued-to — Organization | Supports transaction and vendor analysis. |
| Location — exposed-to — Hazard | Connects property or operations to risk context. |
| Claim — related-to — Prior Claim | Represents an approved and explainable relationship, not merely a similarity score. |
| Fact — valid-during — Time Period | Preserves temporal meaning. |
Ontology Governance Questions
- Who owns the definition of each business concept and relationship?
- Which source is authoritative when systems disagree?
- How are roles distinguished from identities—for example, claimant, insured, driver, and witness?
- Which inferred relationships are allowed, and how are they labeled differently from observed facts?
- How are jurisdiction, product, line of business, and time represented?
- How are corrections versioned and propagated to downstream applications?
- Which relationships require human confirmation before use in a consequential workflow?
- How are sensitive attributes and restricted data separated or access-controlled?
Minimal Viable Ontology
A successful program usually begins with a focused ontology aligned to one or two high-value use cases. Attempting to model the entire carrier at once can create prolonged design work with little operational value. The minimal ontology should still include stable identifiers, provenance, time, confidence, ownership, and extensibility so that later use cases do not require a complete redesign.
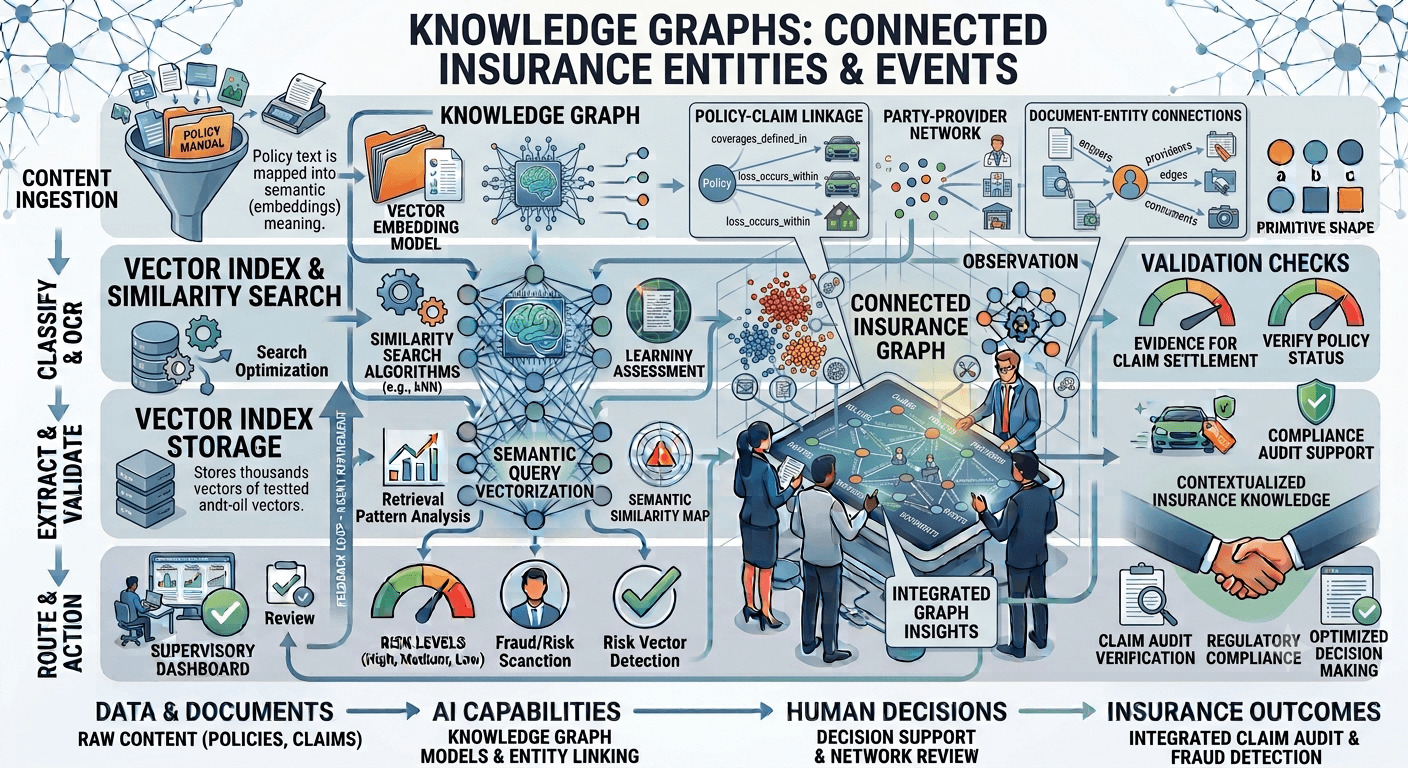
Applications Across the P&C Value Chain
| Insurance Workflow | Knowledge-Graph Contribution |
|---|---|
| FNOL and intake | Connect parties, vehicles, properties, locations, policy terms, prior interactions, and incoming evidence. |
| Claims triage | Assemble connected severity, representation, medical, venue, coverage, and exposure context for professional review. |
| Investigation | Reveal relationships among people, organizations, addresses, providers, attorneys, repair facilities, and prior events. |
| Medical review | Connect diagnoses, procedures, providers, treatment sequences, bills, restrictions, and source documents. |
| Litigation monitoring | Link counsel, venue, pleadings, events, demands, experts, rulings, reserves, and settlement activity. |
| Subrogation | Connect responsible parties, contracts, vendors, products, evidence, notices, and recovery rights. |
| Fraud detection | Support network analysis and anomaly review while preserving evidence and avoiding guilt-by-association. |
| Underwriting intake | Connect submission documents to applicant entities, operations, locations, exposures, controls, and policy history. |
| Risk selection | Assemble ownership, corporate hierarchy, locations, hazards, loss history, controls, and appetite rules. |
| Portfolio management | Reveal concentrations and connected exposures across geography, supply chains, ownership, counterparties, and perils. |
| Customer and broker service | Provide a consistent view of relationships among accounts, policies, claims, contacts, requests, and communications. |
| Regulatory and audit support | Trace decisions, data sources, evidence, changes, access, and governed interpretations. |
Claims Relationship Intelligence
Claims teams frequently need to understand a network, not a record. A graph can help an investigator see that multiple claims involve the same provider group, repair facility, attorney office, address, phone number, vehicle, employer, or pattern of documentation. The graph does not establish wrongdoing. It organizes connected facts so qualified professionals can determine whether additional review is warranted.
Coverage and Policy Context
Coverage analysis depends on the policy version, endorsements, effective dates, insured roles, property or vehicle schedules, jurisdiction, and loss facts. A graph can connect the applicable contract components to the claim evidence and preserve the path from a coverage question to the relevant policy language. Final coverage decisions remain with authorized professionals.
Catastrophe and Accumulation Analysis
A graph can connect insured locations, parent organizations, suppliers, infrastructure dependencies, policies, perils, and event footprints. This can reveal indirect concentration that is difficult to see in a location-only view. Temporal and geospatial models may be combined with graph relationships to support catastrophe response and portfolio management.
Enterprise Search and Knowledge Discovery
Knowledge graphs improve search by adding semantic context. A user searching for a provider can retrieve aliases, related organizations, relevant claims, source documents, locations, and time periods. The graph can also constrain retrieval so an AI assistant receives only facts and documents connected to the approved task and user permissions.
Detailed Claims Case Study
Scenario: Complex Commercial Auto Bodily Injury Claim
A commercial auto claim begins as a reported intersection collision. Initial facts suggest moderate vehicle damage and soft-tissue injury. Over the next several months, new treatment, representation, diagnostic findings, wage-loss allegations, and a policy-limits demand emerge across emails, medical records, bills, police materials, and claim-system notes.
The Fragmented-State Problem
- Policy and vehicle data are stored in the core system.
- Police and medical documents are stored in an imaging repository.
- Attorney representation arrives by email and is manually summarized.
- Provider names vary across bills, records, and third-party data.
- Reserve changes are transactional, while the reasons are in adjuster notes.
- Litigation and venue context reside in separate tools or external sources.
- Claims leadership cannot easily see how the evidence developed over time.
Graph Construction
| Graph Element | Illustrative Content | Control |
|---|---|---|
| Claim node | Claim identifier, line, jurisdiction, loss date, status | Core-system identifier is authoritative. |
| Party nodes | Insured driver, claimant, witnesses, employer | Identity confidence and role are stored separately. |
| Asset nodes | Tractor, trailer, claimant vehicle | VIN and scheduled-vehicle relationships are validated. |
| Medical nodes | Providers, diagnoses, procedures, treatment events | Every extracted item links to page-level evidence. |
| Legal nodes | Attorney, demand, venue, complaint, mediation | Event time and source are preserved. |
| Financial nodes | Reserve, payment, bill, demand amount | Transaction history is not overwritten. |
| Evidence edges | Document supports fact; note explains reserve change | Provenance and reviewer status are required. |
Connected Review
The graph shows that the claimant began treating at an urgent-care facility, later visited an orthopedic practice, received imaging, and was referred to a surgical specialist. It also shows the timing of attorney involvement, the first surgery recommendation, reserve changes, and the eventual demand. A claims professional can traverse from each asserted fact to the source document and review whether the relationship is observed, extracted, or inferred.
AI-Assisted Use
A RAG application uses the graph to assemble a task-specific subgraph: applicable policy, involved parties, injury timeline, treatment providers, major medical findings, demand allegations, reserve history, and source documents. The LLM produces a structured summary with citations. A predictive model may use approved graph-derived features, such as treatment progression or legal-event timing, but the model output is presented as decision support rather than a liability or settlement decision.
Human Decision Points
- Validate the identity of parties and providers when matching is uncertain.
- Confirm whether a medical event is documented, alleged, recommended, scheduled, or completed.
- Determine whether policy language applies to the facts and jurisdiction.
- Assess liability, causation, damages, reserve adequacy, strategy, and authority.
- Correct graph relationships when source evidence is incomplete or contradictory.
Illustrative Outcomes
The carrier may achieve faster file orientation, more consistent escalation, fewer missed relationships, better reserve-review preparation, and stronger auditability. Outcome measurement should compare the graph-enabled workflow with a baseline and control for claim mix. The goal is improved information and professional action, not automatic claim disposition.
Detailed Underwriting Case Study
Scenario: Multi-Location Commercial Property Submission
An underwriter receives a submission containing applications, schedules of values, loss runs, engineering reports, statements of values, corporate documents, and broker correspondence. Locations appear under slightly different names, subsidiaries share ownership, and some properties depend on common utilities and suppliers.
Graph-Enabled Submission Model
| Entity | Relationships | Underwriting Value |
|---|---|---|
| Applicant organization | owns subsidiary; operates location; named-on policy | Clarifies corporate structure and insured interests. |
| Location | contains building; exposed-to peril; depends-on utility | Supports risk and accumulation context. |
| Building | has occupancy; constructed-of material; protected-by system | Connects property characteristics to evidence. |
| Loss event | occurred-at location; caused-by peril; paid-under policy | Links loss history to the correct exposure. |
| Engineering recommendation | applies-to location; addresses hazard; has status | Tracks risk-improvement evidence. |
| Document | supports attribute; submitted-by broker; valid-as-of date | Preserves provenance and freshness. |
| Policy term | covers location; includes limit; subject-to condition | Connects selection and terms to contract context. |
Underwriter Workbench
The graph powers a workbench that presents the account hierarchy, locations, values, hazards, loss history, recommendations, and supporting documents. The underwriter can select a location and see all related information, or begin with a recommendation and trace it to the affected building, inspection report, status update, and proposed term.
Portfolio Context
The same representation can connect the prospective risk to existing portfolio concentrations, provided access and governance rules permit. The underwriter may see that several insured locations depend on the same logistics hub or occupy buildings owned by a common landlord. This relationship context can inform referral or aggregation review without replacing underwriting authority.
Decision Support, Not Automated Selection
AI can identify missing schedules, inconsistent addresses, unverified construction attributes, stale engineering information, or connected concentration. The underwriter retains authority over appetite, risk selection, pricing inputs, terms, conditions, and referrals. The graph should make evidence easier to inspect and should clearly distinguish submitted facts, third-party data, inferred relationships, and professional conclusions.
Illustrative Outcomes
- Reduced time reconciling names, locations, and documents.
- More complete risk context and fewer hidden relationships.
- Faster identification of missing or contradictory submission information.
- Improved consistency in referral preparation and portfolio review.
- Better traceability from underwriting conclusions to source evidence.
Knowledge Graphs with RAG, LLMs, and AI Agents
Graph-Enhanced Retrieval-Augmented Generation
Traditional RAG often retrieves text chunks based on lexical or vector similarity. Graph-enhanced RAG can first identify relevant entities and relationships, then retrieve documents connected to that subgraph. This helps the system assemble context around the actual claim, policy version, party role, event sequence, or insured location rather than relying only on semantic similarity.
| RAG Pattern | How It Works | Insurance Strength |
|---|---|---|
| Vector RAG | Retrieves semantically similar chunks. | Good for broad language similarity and document discovery. |
| Metadata-filtered RAG | Applies claim, policy, date, role, jurisdiction, or access filters. | Reduces irrelevant or unauthorized context. |
| Graph RAG | Traverses entity and relationship context before or during retrieval. | Strong for multi-hop questions, provenance, and connected evidence. |
| Hybrid RAG | Combines keyword, vector, metadata, and graph retrieval with reranking. | Often the most practical enterprise pattern. |
LLM Grounding and Explainability
The graph can provide structured facts and evidence paths to an LLM. A generated answer should cite the underlying sources and avoid converting uncertain or inferred graph relationships into definitive statements. The application should disclose whether a fact came from a core system, a document extraction, a third-party source, a human conclusion, or an inference rule.
AI Agents
An agent may use the graph to plan and execute bounded tasks—for example, gathering claim context for a reserve review, checking whether requested submission documents are present, or preparing a referral package. The graph can constrain tool access and give the agent a consistent view of entities and permissions. Consequential actions should require approval, and the agent’s traversal, retrieval, and outputs should be logged.
Predictive AI and Graph Features
Graph-derived features can capture network degree, relationship counts, temporal sequences, community structure, path patterns, or connected exposures. These features can improve predictive models, but they can also create hidden proxies or guilt-by-association effects. Feature approval, fairness review, stability testing, and business interpretation are essential.
Graph Neural Networks
Graph neural networks learn representations from graph structure and node or edge attributes. They may support link prediction, classification, anomaly detection, and network analysis. Their complexity can make interpretation and governance more difficult. A carrier should use them only when simpler methods do not meet the business need and when the organization can validate, monitor, and explain the model appropriately.
Business Benefits and Value Measurement
| Benefit | Operational Meaning |
|---|---|
| Connected context | Professionals see relevant relationships across systems and documents. |
| Faster investigation | Graph traversal reduces manual searching and reconciliation. |
| Better retrieval | Search uses entity meaning, relationships, time, and provenance. |
| Explainable evidence | Users can inspect why a fact or connection appears. |
| Reusable knowledge | A governed semantic layer can support multiple applications. |
| Improved AI grounding | RAG and agents receive structured, task-relevant context. |
| Network insight | Teams can identify patterns that record-by-record analysis misses. |
| Data quality visibility | Conflicts, missing links, duplicates, and stale facts become easier to detect. |
Value Metrics
| Measurement Area | Illustrative Measures |
|---|---|
| Efficiency | Time to orient to file; search time; manual reconciliation effort; referral preparation time. |
| Quality | Missing-fact rate; duplicate-entity rate; erroneous-link rate; source-citation coverage. |
| Claims outcomes | Time to escalation; reserve-review timeliness; subrogation identification; investigation cycle time. |
| Underwriting outcomes | Submission completeness; time to quote; referral turnaround; concentration identification. |
| AI performance | Retrieval precision; grounded-answer rate; citation accuracy; unsupported-claim rate. |
| Governance | Percentage of facts with provenance; access violations; stale relationships; correction cycle time. |
| Adoption | Active users; repeat use; task completion; professional override and feedback patterns. |
Value Realization Principles
- Tie the graph to a defined workflow and measurable decision bottleneck.
- Measure data and relationship quality before attributing business outcomes to AI.
- Use baseline and comparison groups where feasible.
- Separate improved information quality from downstream financial outcomes.
- Count governance, auditability, and reuse as enterprise value—not only labor savings.
- Avoid claiming causation when many operational changes occur at the same time.
Value Realization Principles
Executive caution A large graph is not evidence of business value. The meaningful question is whether connected, governed knowledge improves a specific workflow, decision, control, or customer outcome.
Risks, Governance, Security, and Compliance
| Risk | Why It Matters | Primary Controls |
|---|---|---|
| False entity merge | Two different entities are treated as one. | Confidence thresholds, authoritative identifiers, review queues, reversible merges. |
| Missed entity match | Records for the same entity remain disconnected. | Normalization, multi-signal matching, quality monitoring, feedback loops. |
| Unsupported relationship | The graph asserts a connection without sufficient evidence. | Provenance, relationship status, confidence, source citation, human validation. |
| Stale knowledge | An old relationship is treated as current. | Effective dates, event dates, expiration, refresh SLAs, temporal queries. |
| Inference overreach | A rule or model turns correlation into an unjustified conclusion. | Label inferred facts, restrict consequential use, professional review. |
| Bias and proxy risk | Network relationships encode social, geographic, medical, or economic proxies. | Feature review, fairness testing, purpose limitation, sensitive-data controls. |
| Privacy leakage | Graph traversal exposes sensitive relationships beyond need-to-know. | Fine-grained authorization, purpose-based access, masking, audit logs. |
| Security compromise | A connected graph becomes a high-value map of the enterprise. | Segmentation, encryption, least privilege, monitoring, incident response. |
| Graph poisoning | Incorrect or malicious facts alter downstream retrieval or reasoning. | Source trust tiers, validation, signed ingestion, anomaly checks, rollback. |
| Explainability gap | Users see a score or connection but not the path and evidence. | Path explanation, provenance display, confidence, user-friendly evidence views. |
Governance Operating Model
- Business ontology council: defines concepts, relationships, and acceptable uses.
- Data stewardship: owns source mapping, quality rules, identifiers, and corrections.
- Model-risk and responsible-AI review: evaluates inferred relationships and graph-derived features.
- Security and privacy: enforces purpose-based access, sensitive-data controls, retention, and monitoring.
- Legal and compliance: reviews regulatory, discovery, consumer, employment, and contractual implications.
- Operational owners: validate that graph-supported workflows remain accurate and useful.
- Change control: versions ontology, mappings, rules, and downstream dependencies.
Fraud and Investigation Guardrail
Association is not proof A shared address, provider, attorney, repair facility, phone number, or other network connection may be legitimate. Graph relationships should support investigation and prioritization, not automatic allegations, adverse action, or unsupported conclusions.
Access-Control Design
A graph can expose relationships that individual source systems would not reveal in one view. Access should therefore be enforced at the entity, property, relationship, document, and purpose level when appropriate. The system should preserve the user’s source-system entitlements rather than using the graph as a path around them.
Auditability
For material uses, the carrier should be able to reconstruct which source facts, relationships, ontology version, retrieval path, model version, and user actions contributed to an output. Corrections should not erase historical evidence needed for audit, dispute resolution, or regulatory review.
Implementation Blueprint and Best Practices
Phased Implementation
| Phase | Key Work |
|---|---|
| 1. Define outcome | Choose a workflow with a relationship problem and measurable baseline. |
| 2. Scope ontology | Define the minimum entities, relationships, time, provenance, and ownership. |
| 3. Inventory sources | Identify authoritative systems, documents, identifiers, rights, and refresh patterns. |
| 4. Resolve identity | Establish matching rules, confidence, review, and correction mechanisms. |
| 5. Build ingestion | Extract, normalize, map, validate, and load facts with provenance. |
| 6. Deliver workflow | Expose the graph through search, visualization, RAG, analytics, or an application. |
| 7. Validate | Test data quality, relationship accuracy, permissions, usability, and business outcomes. |
| 8. Govern change | Version ontology and mappings; monitor quality, drift, access, and downstream effects. |
| 9. Expand deliberately | Add use cases that reuse the graph without weakening semantic integrity. |
Best Practices
- Start with business questions and decisions, not a technology-first graph program.
- Use a small, reusable ontology and expand it through controlled change.
- Store provenance, time, confidence, and review status as first-class information.
- Distinguish observed, extracted, inferred, and professionally determined facts.
- Make entity merges reversible and auditable.
- Test relationship accuracy at the path level, not only node-level completeness.
- Preserve source-system authority and access controls.
- Design user experiences that show evidence, not just graph visualizations.
- Pair technical metrics with workflow and outcome measures.
- Create correction and feedback processes before broad adoption.
Common Mistakes
- Trying to model the entire enterprise before delivering one useful workflow.
- Confusing a graph database implementation with a governed knowledge asset.
- Assuming shared attributes always imply a meaningful relationship.
- Overwriting changing facts instead of modeling time and history.
- Allowing inferred relationships to appear as verified facts.
- Ignoring source-system permissions when exposing connected data.
- Building visually impressive network diagrams that do not improve decisions.
- Using graph-derived features without proxy, fairness, and interpretability review.
- Failing to budget for ontology stewardship and continuous data-quality work.
Build, Buy, or Hybrid
| Option | Advantages | Considerations |
|---|---|---|
| Build | Maximum control over ontology, integration, and differentiation. | Requires graph engineering, semantic modeling, operations, governance, and sustained investment. |
| Buy | Faster access to packaged capabilities and domain accelerators. | Validate data portability, ontology flexibility, explainability, security, and integration depth. |
| Hybrid | Use platform components while retaining carrier-specific ontology and workflow control. | Requires clear boundaries, ownership, APIs, and change-management discipline. |
Executive Decision Guide
When a Knowledge Graph Is a Strong Fit
- The business question requires multiple relationships or hops across systems.
- Users spend substantial time reconciling identities, roles, documents, and events.
- Provenance and explainability are central to trust.
- AI applications need structured, permission-aware grounding.
- Many-to-many relationships and changing roles are difficult to model in current tools.
- The carrier wants a reusable semantic layer across claims, underwriting, and enterprise knowledge.
When Another Approach May Be Better
- The need is a straightforward transactional lookup or aggregate report.
- Relationship semantics are not material to the decision.
- Source data and identifiers are too unreliable to support trustworthy links.
- The organization lacks ownership for ontology, stewardship, and corrections.
- A narrow search index or relational model can meet the requirement with less complexity.
Executive Questions Before Approval
| Decision Area | Question |
|---|---|
| Business outcome | Which decision or workflow becomes materially better because relationships are explicit? |
| Scope | What is the minimal graph needed for the first use case? |
| Authority | Which systems and sources are authoritative for each concept? |
| Identity | How will false merges and missed matches be measured and corrected? |
| Evidence | Can every material fact and relationship be traced to its source? |
| Time | How will the graph represent changing facts and historical state? |
| Access | Will connected data expose information beyond the user’s approved purpose? |
| AI use | How will RAG, models, or agents distinguish facts from inferences? |
| Human review | Which relationships or actions require professional confirmation? |
| Value | What baseline and outcome metrics will be used? |
| Sustainability | Who owns ontology, quality, change control, and operating cost? |
Recommended Approval Gate
Proceed when The use case has measurable relationship complexity; the ontology and authoritative sources are defined; identity and provenance controls are operational; access is purpose-limited; professional review is embedded; and the expected workflow value justifies ongoing stewardship.
Charlee.ai Perspective
For insurance AI, connected context is often more important than a larger model. A claim outcome is rarely explained by one document, one field, or one event. It develops through relationships among people, injuries, providers, attorneys, communications, venues, reserves, and decisions over time. A knowledge graph can organize that context into a form that both professionals and governed AI systems can use.
The strongest design is evidence-first. Every surfaced relationship should lead the professional back to the underlying source. Extracted facts should be labeled as extracted. Inferred links should be labeled as inferred. Model predictions should remain distinct from verified claim facts. This separation helps the organization use AI without blurring evidence, interpretation, and decision authority.
A knowledge graph can also help bridge legacy environments. Rather than requiring wholesale replacement of core platforms, the graph can connect policy, claims, document, communication, and analytics sources through secure integration patterns. It becomes a governed context layer embedded into existing workflows.
People-plus-AI principle The graph should help claims professionals, underwriters, managers, and investigators see connected evidence earlier and act with greater confidence. It should not make unreviewed coverage, liability, fraud, pricing, settlement, or employment decisions.
Practical Design Principles
- Business purpose and authorized use come before graph expansion.
- Evidence, source citation, and time context are part of every material relationship.
- Human judgment remains responsible for consequential insurance decisions.
- Graph-supported AI should be explainable at the fact, path, document, and workflow level.
- Monitoring should include corrections, overrides, missed relationships, unsupported links, and operational outcomes.
- Controlled change is essential because ontology changes can affect search, models, agents, dashboards, and decisions.
Key Takeaways
- Knowledge graphs make insurance relationships explicit, queryable, and explainable.
- They are especially valuable when facts are fragmented across systems, documents, and time.
- Ontology, identity resolution, provenance, and temporal modeling determine trustworthiness.
- Graphs can strengthen search, RAG, predictive AI, and agents by assembling connected context.
- Associations must not be treated as proof; consequential decisions require professional review.
- Access controls must account for the new insights created when data is connected.
- A focused use case with measurable workflow value is a better starting point than an enterprise-wide graph mandate.
- The long-term asset is governed business knowledge, not the graph technology alone.
Knowledge graphs provide a structured way to represent real-world entities, their attributes, and the relationships among them. In property and casualty insurance, they can connect fragmented information across claims, policies, insureds, claimants, providers, attorneys, vehicles, properties, documents, transactions, exposures, and events—while preserving context and provenance.
Frequently Asked Questions
It is a structured map of business facts and the relationships among them, with enough meaning and source context for people and systems to use the connections.
Insurance decisions depend on connected policies, parties, assets, events, documents, transactions, and evidence. Graphs make those relationships easier to query, review, and explain.
No. A graph database is a storage and query technology. A knowledge graph is the governed semantic asset, including data, definitions, relationships, provenance, and intended uses.
Usually not. A graph can connect information from existing systems and documents through secure integration while those systems remain authoritative.
An ontology defines the concepts, relationships, hierarchies, constraints, and business meanings used in the graph.
A warehouse is optimized for structured analytics and aggregation. A graph is optimized for connected context, traversal, semantic relationships, and evidence paths.
Yes. It can identify relevant entities and relationships, constrain retrieval, assemble multi-hop context, and provide better provenance for generated answers.
They can reduce unsupported generation by grounding answers in approved facts and sources, but they cannot guarantee accuracy. Retrieval, prompts, models, citations, and professional review still require validation.
It is the process of deciding whether different records refer to the same real-world person, organization, asset, provider, address, or other entity.
False merges can create misleading relationships; missed matches can hide relevant connections. Both must be measured, reviewed, and correctable.
They can support network analysis and investigation by organizing relationships. A relationship alone is not proof of fraud and should not trigger unsupported adverse action.
The graph should preserve when an event occurred, when a fact was effective, when it was learned, and when it entered the system when those distinctions matter.
Provenance records where a fact came from, such as a core system, document page, communication, third-party source, extraction process, or approved inference.
They can be highly explainable when applications show relationship paths, source evidence, dates, confidence, and whether the connection was observed or inferred.
Yes. Graph relationships can produce features or embeddings, but carriers must review them for stability, proxy effects, fairness, and interpretability.
A focused workflow with fragmented information, important relationships, measurable manual effort, and a clear professional decision—such as complex claim review or multi-location submission analysis.
Ownership is shared: business leaders own meaning and use; data stewards own quality and sources; technology operates the platform; security, privacy, legal, compliance, and model-risk functions govern controls.
Measure relationship accuracy, provenance coverage, search and retrieval quality, workflow time, user adoption, decision quality, governance outcomes, and business results against a baseline.